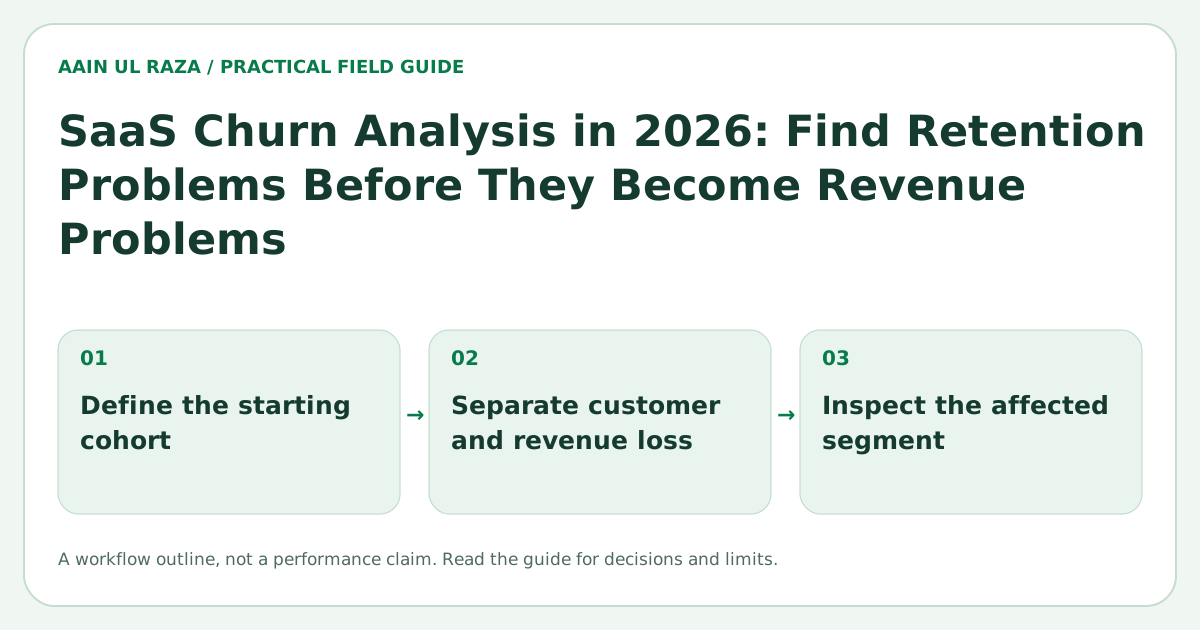
SaaS Churn Analysis in 2026: Find Retention Problems Before They Become Revenue Problems
Learn how to analyze SaaS logo churn, revenue churn, cohorts, activation, cancellation reasons and product behavior to find retention problems early and prioritize fixes.
Updated · Sources, examples and corrections
Churn is often reported as one number. That number is useful, but it rarely tells you what to fix.
A SaaS business can have the same headline churn rate for very different reasons. New customers may fail during onboarding. Long term customers may leave after a pricing change. A single high value account may distort revenue churn. One acquisition channel may bring many signups that never reach meaningful value.
A useful churn analysis separates those patterns.
The objective is not only to calculate churn correctly. It is to connect churn to customer behavior, lifecycle stage, acquisition source, product usage and cancellation evidence so the team can decide what to change.
Start with more than one churn metric
At minimum, track logo churn and revenue churn separately.
Logo churn
Logo churn measures the percentage of customers lost during a period.
A simple monthly formula is:
customers lost during month / customers at start of month
If you start with 200 customers and lose 8, logo churn is 4 percent.
Gross revenue churn
Gross revenue churn measures recurring revenue lost from cancellations and downgrades, excluding expansion.
This tells you whether the accounts leaving are economically meaningful.
Net revenue retention
Net revenue retention considers starting recurring revenue, contractions, churn and expansion.
A business can lose some customers and still have strong net retention if retained customers expand. That does not mean logo churn should be ignored. It means the metrics answer different questions.
Do not mix customer acquisition with retention diagnosis
A growing SaaS company can hide retention problems behind new sales.
If 100 customers leave and 150 new customers arrive, the total customer count still grows. The operating problem remains.
For retention analysis, separate:
- New customer additions.
- Existing customer losses.
- Expansion.
- Contraction.
- Reactivation.
This creates a clearer picture of the installed customer base.
Analyze churn by cohort
Cohorts reveal whether retention is improving for newer customers.
Create a cohort based on signup month or activation month. Then track the percentage of customers or revenue that remains after one, two, three, six and twelve months.
A simple cohort table might look like this:
| Cohort | Month 1 | Month 2 | Month 3 | Month 6 |
|---|---|---|---|---|
| January | 82% | 74% | 69% | 61% |
| February | 86% | 79% | 74% | 66% |
| March | 89% | 83% | 79% | 72% |
This is an illustrative example. The important signal is the shape. If newer cohorts retain better, recent product or onboarding changes may be working. If every cohort drops sharply at the same point, the problem may be structural.
The SaaS Onboarding Metrics guide explains how activation and time to value connect to early retention.
Segment churn before interpreting it
A single churn rate can hide important differences.
Useful segments include:
- Plan.
- Company size.
- Acquisition channel.
- Country or market.
- Product use case.
- Sales assisted versus self serve.
- Activated versus never activated.
- Feature adoption level.
- Tenure.
The goal is not to create dozens of dashboards. Start with segments that could lead to a different action.
For example, if customers acquired through a particular campaign churn at twice the rate of referrals, the problem may be expectation setting rather than onboarding.
Define activation carefully
A customer who paid is not necessarily activated.
Activation should represent the first meaningful outcome that demonstrates product value.
For a CRM, activation might require importing contacts and moving at least one real lead through a pipeline. For an SEO product, activation might mean completing an audit and reviewing prioritized issues. For an automation product, activation might mean successfully running a live workflow.
Then compare churn between activated and non activated customers.
If activation has a strong relationship with retention, the onboarding roadmap becomes clearer.
Measure time to value
Time to value measures how long it takes a new customer to reach the first meaningful outcome.
Long time to value can create churn even when the product is capable.
Analyze:
- Median time to activation.
- Percentage activated within one day, three days and seven days.
- Steps where setup stalls.
- Support contacts before activation.
The best improvement may be removing a step rather than adding another tutorial.
Build a churn reason system that produces usable data
Cancellation surveys often fail because the options are too vague.
Too expensive can mean many things:
- The customer never saw enough value.
- The customer is temporarily cutting costs.
- The plan structure does not match usage.
- A competitor offers a required feature.
- The buyer changed.
Use a short reason list, allow free text and follow up on high value accounts.
A practical reason taxonomy might include:
- No longer needed.
- Missing capability.
- Too difficult to use.
- Price versus value.
- Technical reliability.
- Switched to another solution.
- Business closed or paused.
- Internal priority changed.
- Other.
Then keep the original customer language in a notes field. The category helps reporting. The verbatim explanation provides context.
Connect cancellation reasons to behavior
Survey answers are stronger when combined with product data.
A customer might select too expensive, but usage data may show they never completed setup. That suggests the real issue could be value realization.
Create a churn review table with fields such as:
| Field | Why it matters |
|---|---|
| Plan | Pricing context |
| Tenure | Early versus mature churn |
| Activation status | Onboarding signal |
| Last meaningful activity | Engagement signal |
| Key features used | Adoption depth |
| Support volume | Friction signal |
| Acquisition source | Expectation quality |
| Cancellation reason | Stated reason |
| Revenue | Economic impact |
This dataset is far more actionable than a single churn chart.
Look for leading indicators
Churn is a lagging outcome. By the time the cancellation arrives, the underlying problem may have existed for weeks.
Possible leading indicators include:
- No login for an important workflow period.
- Declining usage frequency.
- Failure to adopt a key feature.
- Repeated errors.
- A spike in support tickets.
- A billing failure.
- A change in the primary contact.
- A reduction in team members or connected data.
Do not turn every signal into an automated warning. First test whether it actually correlates with churn.
Separate preventable and non preventable churn
Not every lost customer is a product failure.
A customer can leave because the company closed, the project ended or the business changed direction.
Classifying churn as preventable, partially preventable or non preventable helps the team focus on problems it can influence.
This classification should be reviewed periodically because teams can easily label uncomfortable churn as unavoidable.
Prioritize by revenue, frequency and fixability
A churn reason may be common but low impact. Another may affect only a few accounts but represent significant recurring revenue.
Score churn problems using:
- Frequency.
- Revenue at risk.
- Strategic segment importance.
- Confidence in the root cause.
- Effort to fix.
- Time to validate improvement.
This converts churn analysis into roadmap decisions.
Run retention experiments carefully
Examples of retention experiments include:
- Shorter onboarding.
- Better setup defaults.
- A milestone based checklist.
- In app prompts tied to actual usage gaps.
- New pricing or packaging.
- Proactive support for stalled accounts.
- Reliability improvements.
Define the expected behavior change before launch. Then compare relevant cohorts rather than looking only at overall churn.
The SEO Experimentation in 2026 article focuses on search experiments, but the same discipline applies: define the hypothesis, isolate the change, measure the right outcome and avoid reading too much into noisy data.
Build a monthly churn review
A useful monthly review can fit on one page:
- Logo churn and gross revenue churn.
- Net revenue retention.
- Cohort retention trend.
- Churn by plan and acquisition source.
- Activation and time to value.
- Top cancellation reasons.
- Largest lost accounts with context.
- Leading risk signals.
- Actions from the previous month.
- One or two prioritized experiments.
The review should end with decisions, not more charts.
A cohort calculation that separates logos from revenue
Take this entirely fictional starting cohort: 40 paying accounts representing $4,000 in monthly recurring revenue. During the month, 3 accounts totaling $800 cancel and one remaining account expands by $200. Logo churn is 3 / 40 = 7.5%. Gross revenue churn is $800 / $4,000 = 20%. Net revenue churn, if expansion is included in the numerator, is ($800 - $200) / $4,000 = 15%.
These rates describe different questions; none should be used interchangeably. Keep new customers out of the starting-cohort denominator, and document whether downgrades, refunds and annual contracts affect your revenue definitions. Validate source billing records before publishing any figure as company performance.
Define what counts as an active customer
Google Analytics events can capture usage signals, but a billed customer and an active user are different entities. State your denominator, observation window and treatment of pauses before interpreting churn, retention or product-activation metrics.
Reconcile a renewal cohort before reading churn
Use a fictional cohort of 100 paying accounts at the start of a month. If eight cancel and three new accounts arrive, logo churn for the opening cohort remains 8%; new acquisitions do not reduce it to 5%.
For revenue retention, start with that cohort's recurring revenue and track its contractions, expansions and cancellations. Exclude revenue from newly acquired accounts from the existing-cohort retention numerator. State treatment of pauses, refunds, reactivations and currency conversion.
Compare cohorts at the same age. A six-month-old cohort has had more opportunity to churn than a one-month-old cohort. A dashboard mixing ages can make a recent acquisition surge look like a retention improvement. Preserve the underlying account transitions so a reviewer can reproduce the rate.
Further reference: Google Analytics event-collection documentation.

Co-Founder of Strat IQ Digital and builder of CrawlerQue and Stratly Digital, based in West Palm Beach, FL. I work on AI products, SaaS, SEO intelligence, CRM automation and growth systems.